


Search
What Does the Global MPI Tell Us?


The new Global Multidimensional Poverty Index (MPI) Report 2017 was released on June 1st at a special event at the University of Oxford’s Department of International Development to mark the 10th anniversary of the Oxford Poverty & Human Development Initiative (OPHI). It also included the first ever child poverty disaggregation for every country, which found that half of multidimensionally poor people across 103 countries were children.
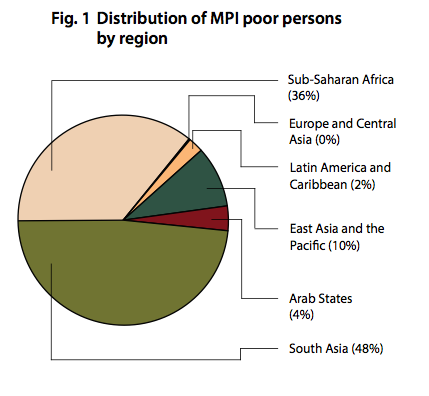
The new report investigates poverty across 5.4 billion people. Of these, 1.45 billion people are MPI poor, some 26.5% of people living in 103 countries. Around 48% of these poor people live in South Asia and 36% in Sub-Saharan Africa. Over one billion MPI poor people live in middle income countries.
Addressing the Sustainable Development Goals (SDGs) aim to end poverty in all its forms and dimensions, the global MPI complements measures based on income and directly measures ten indicators that reflect poor health, lack of education, and low living standards. In 2017, MPI estimations for Algeria and El Salvador were added, and MPI statistics were updated for 23 other countries including China, India, Mexico, and South Africa.
 Turning to the poorest of the poor, OPHI found that nearly half of all MPI poor people are destitute – 706 million – and experience extreme deprivations such as severe malnutrition. Destitution rates are the highest in Sub-Saharan Africa, where in six countries and 117 subnational regions more than half of the citizens live in destitution. But India is home to more destitute people than Sub-Saharan Africa (295 million vs 282 million), and Pakistan is home to more destitute people (37 million) than either East Asia and the Pacific (26 million) or the Arab States (26 million).
Across the 103 low and middle income countries surveyed, children were found to constitute 34% of the total population – but 48% of the poor (the international definition of a child, used here, is anyone less than 18 years of age).
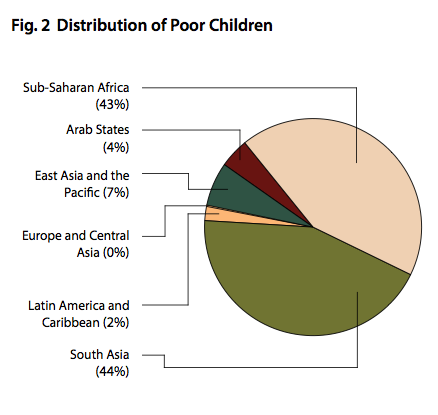
Nearly two out of every five children – 37%, for a total of 689 million children – are multidimensionally poor. Some 87% of these 689 million poor children are growing up in South Asia and in Sub-Saharan Africa – around 300 million in each region. Half of South Asia’s children and two-thirds of Sub-Saharan children are multidimensionally poor.
Across the 103 low and middle income countries surveyed, children were found to constitute 34% of the total population – but 48% of the poor
Half of multidimensionally poor children live in ‘alert’ level fragile states, and child poverty levels are highest in fragile states.
Global MPI estimates are higher for children than for adults in all 103 countries. Children are also deprived in more indicators at the same time. In 36 countries, including India, at least half of all children are MPI poor. In Ethiopia, Niger, and South Sudan over 90% of all children are MPI poor.
 The global MPI can also be disaggregated by disability status. In Uganda, 22% of people live in a household where someone has a severe disability, and the incidence of multidimensional poverty among these households is higher than among households where no one has a disability (77% vs 69%). As disability data improve, this disaggregation for the global MPI will become standard.
Disaggregated analysis of the MPI is also available for 988 subnational regions. The poorest regions in the world are in Chad, Burkina Faso, Niger, Ethiopia, South Sudan, Nigeria, Uganda, and Afghanistan. Inside Afghanistan poverty rates vary from 25% in Kabul to 95% in Urozgan. Within Myanmar, where 30% of people are poor on average, poverty rates rise to 51% in Rakhine State. And in two of Chad’s regions (Lac and Wadi Fira), 98–99% of people are poor. But how people are poor differs. In Lac, 34% of people are poor and have experienced a child’s death; in Wadi Fira that figure is 20%. In turn, 97% are poor and lack clean drinking water in Wadi Fira and 64% in Lac. So even between two extremely poor regions, policy responses need to differ.
The global MPI provides a headline figure showcasing poverty in all its forms and dimensions. Yet it can also be broken down to show in detail the steps needed to change the poverty story – in particular for the rising generation of younger people.

