


Search
Multidimensional Poverty Profile in Palestine


The Multidimensional Poverty Index of Palestine was published in June 2020. This report was prepared by the Palestinian Central Bureau of Statistics (PCBS) and the United Nations Economic and Social Commission for Western Asia (ESCWA) with the support of Oxford Poverty and Human Development Initiative (OPHI), in addition to the National Team for Poverty Combating.
The Palestinian MPI considers two scopes: economic well-being and social well-being. The economic well-being was captured by one dimension and one indicator: the usual National monetary poverty line. The social well-being component comprised of 21 indicators grouped into 6 dimensions: Education (4 indicators); health (4 indicators); employment (4 indicators); housing conditions & access to services (4 indicators); safety and use of assets (3 indicators); and personal freedom (2 indicators).
Source of data is the 2016/17 Palestinian Consumption and Expenditure Survey (PECS).
Main Findings
- Overall poverty incidence in 2016/2017 was 24%. These figures are close but slightly lower than the monetary poverty line (29%).
- There a large difference between the West Bank (11%) and Gaza Strip (45%) in terms of incidence of multidimensional poverty. Poverty in the Gaza Strip is four times as prevalent than in the West Bank.
- The intensity of multidimensional poverty in Palestine is 42.4%. Therefore, poor people face on average 42.4% of the weighted sum of indicators. The disparity in poverty between regions becomes lower if more concern is given to the intensity of poverty. It is 43.3% in Gaza Strip and 40.0% in the West Bank.
- Overall the adjusted head count ratio or MPI is 0.102. The average proportion of deprivation among the poor (intensity) is slightly larger in Gaza Strip than the West Bank, In both the percentage of poor and the MPI – poverty in Gaza is four times as prevalent than in the West Bank.
- In general the south is poorer than the north. This is true for the West Bank. With the exception of Central West Bank, poverty increases consistently if one moves from the north to the south. The poverty rates in the Southern (13.6%) and Northern West Bank (10.5%) were much higher than those of the Central West Bank governorates (7.3%). Thus, the Central West Bank is the most affluent, having the least incidence of poverty.
- There are significant differences in poverty within Gaza Strip as well. The incidence of poverty reached an astonishing rate of 47.8% in Northern and Central Gaza Strip compared to 40.9% in Southern Gaza Strip.
- The results show that poverty is more severe in refugee camps than urban and rural places. Incidence of poverty is 39% in refugee camps as compared to 14% in rural areas and 24% in urban places. This is largely a reflection of high poverty incidence in the Gaza Strip, as the Strip is mainly urban and houses the majority of refugees in Camps.
- Poverty increases consistently by household size. The incidence of poverty in small households with 1 to 3 members is 6% as compared to 36% in large households with 7 or more members.
- As would be expected, monetary poverty is the largest contributor to poverty accounting for 45% of overall deprivation. Also, not surprising is the relatively large contribution of employment deprivation to overall poverty at 13%. The contributions of education and housing conditions are similar at 11%. Safety and use of assets as well as personal freedom contribute about 8% and 7%, respectively, to overall poverty. The smallest contributor to poverty is the health dimension at 5%.
- There are some variations of poverty contribution within dimensions. Aside from the monetary poverty dimension which consists of only one indicator with 45%, the interpersonal and state violence indicator is the second largest contributor to poverty with 7%. Employment benefits, overcrowding, and the economic freedom of women are the next largest with 5%. The relative contributions of the remaining indicators are small, ranging from less than 1% (ownership and use of assets; health access) to about 4% (quality of education; ventilation).
This report is available in English and Arabic.
Palestine MPI. Dimensions and indicators.

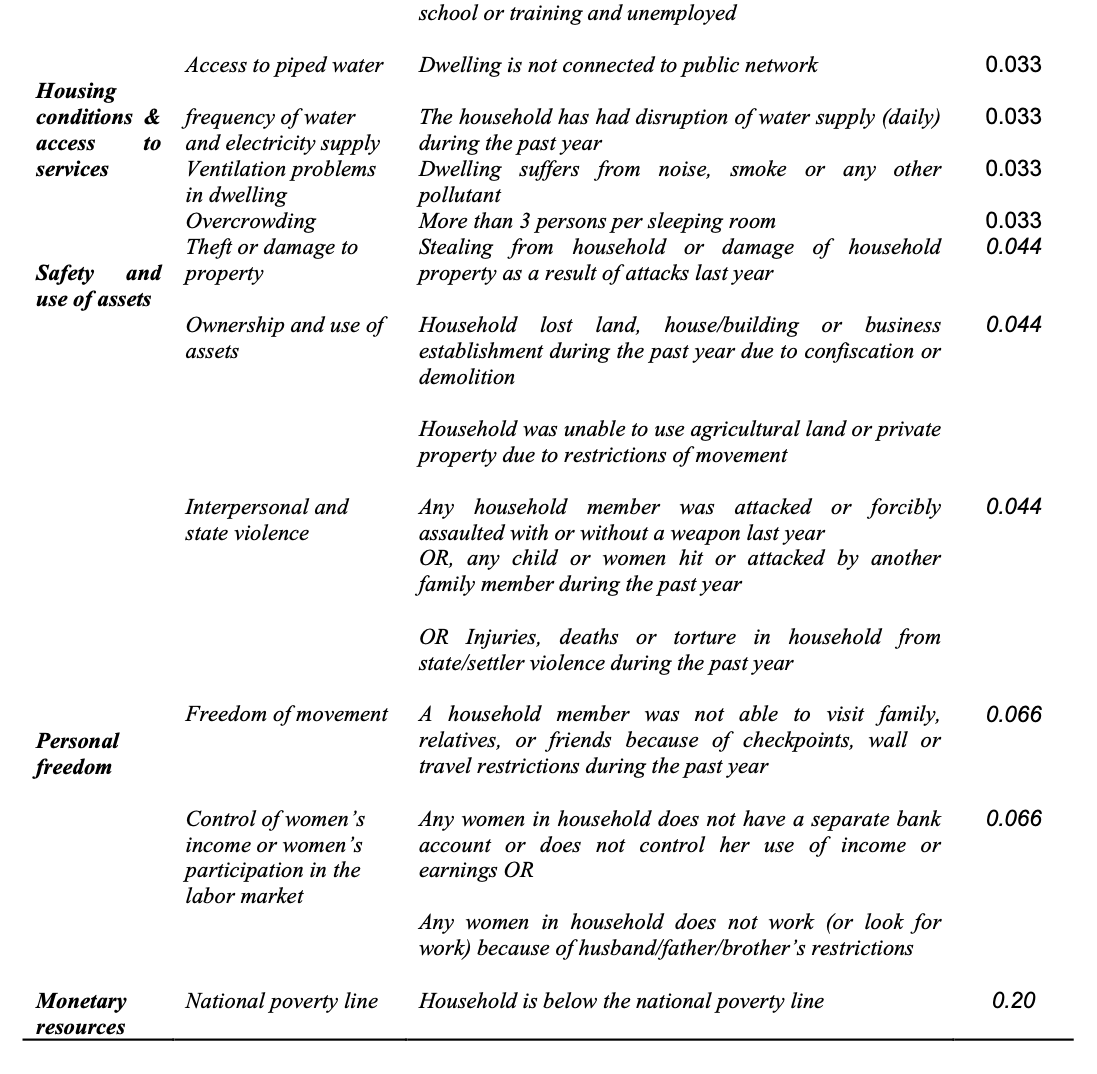
Source: Multidimensional Poverty Profile of Palestine 2017.

