


Search
The South African COVID-19 Vulnerability Index
By Risenga Maluleke, Statistician-General and Head of Statistics South Africa (Stats SA)


The COVID-19 pandemic hit the world unexpectedly. The first case of COVID-19 in South Africa was reported in February 2020. In March of the same year, the President of the Republic declared a state of national disaster in South Africa. By the end of March 2020, South Africa went into hard lockdown. The COVID-19 pandemic threatened to have a devastating impact in South Africa, especially for vulnerable communities. A targeted response was crucial in determining where the most vulnerable populations were located in terms of COVID-19 transmission in the country. Research was initiated to identify populations at multiple risk and develop a geographic visualisation tool (1).
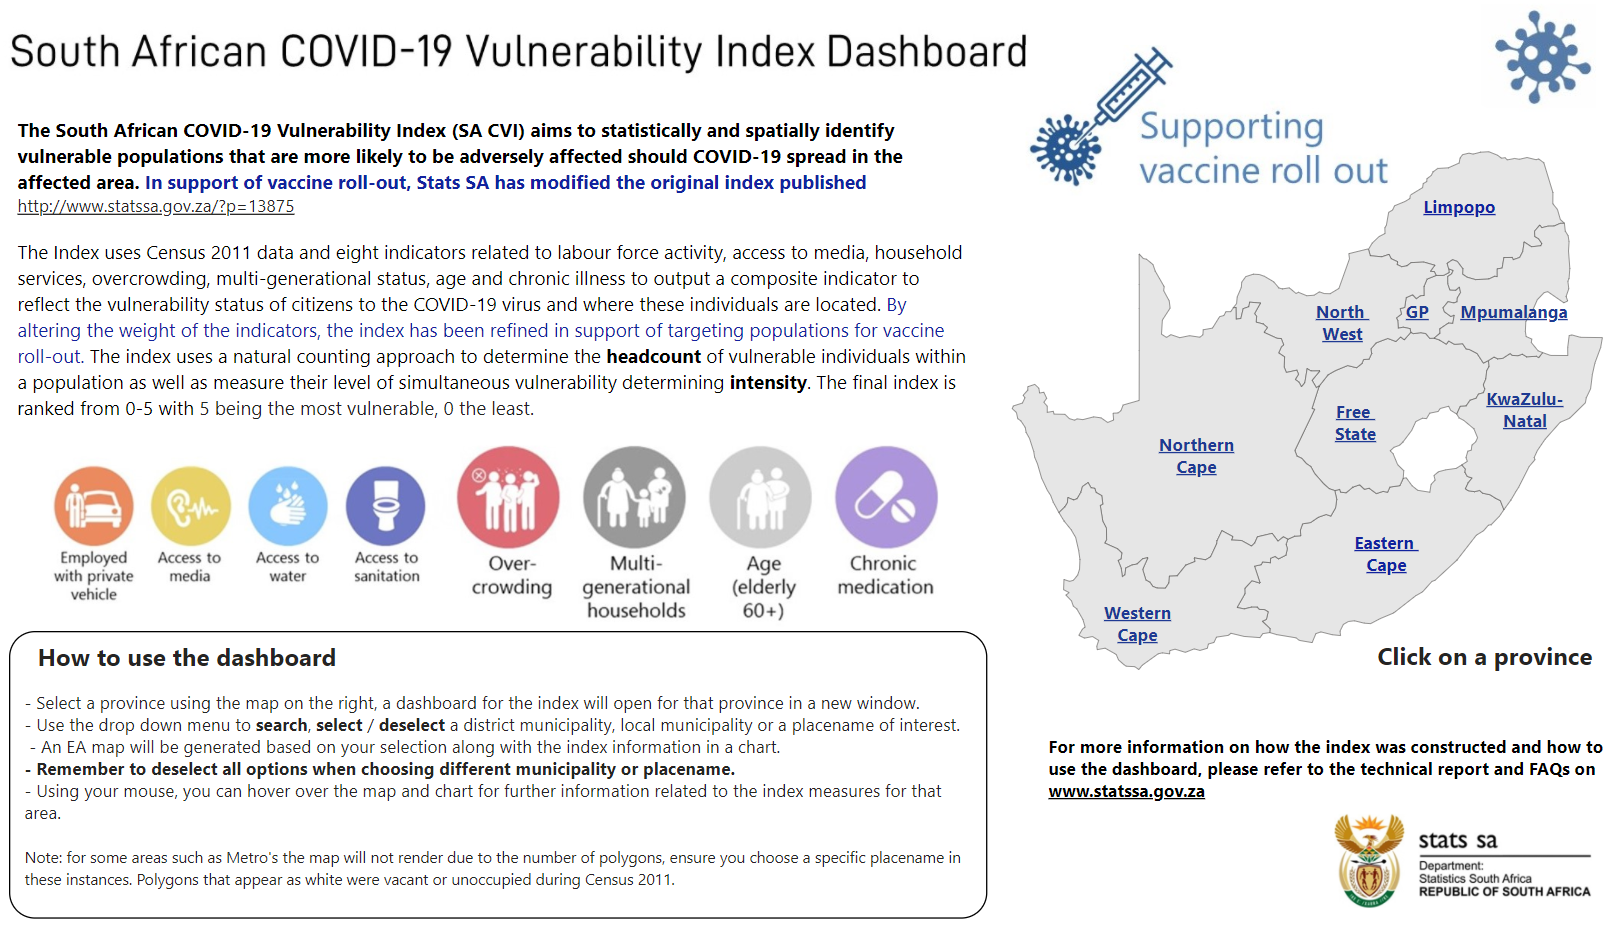
Statistics South Africa conceptualised and compiled a South African COVID-19 Vulnerability Index (SACVI) using Census 2011 data. The index aims to statistically and spatially identify vulnerable populations that are more likely to be adversely affected should COVID-19 spread in their areas.
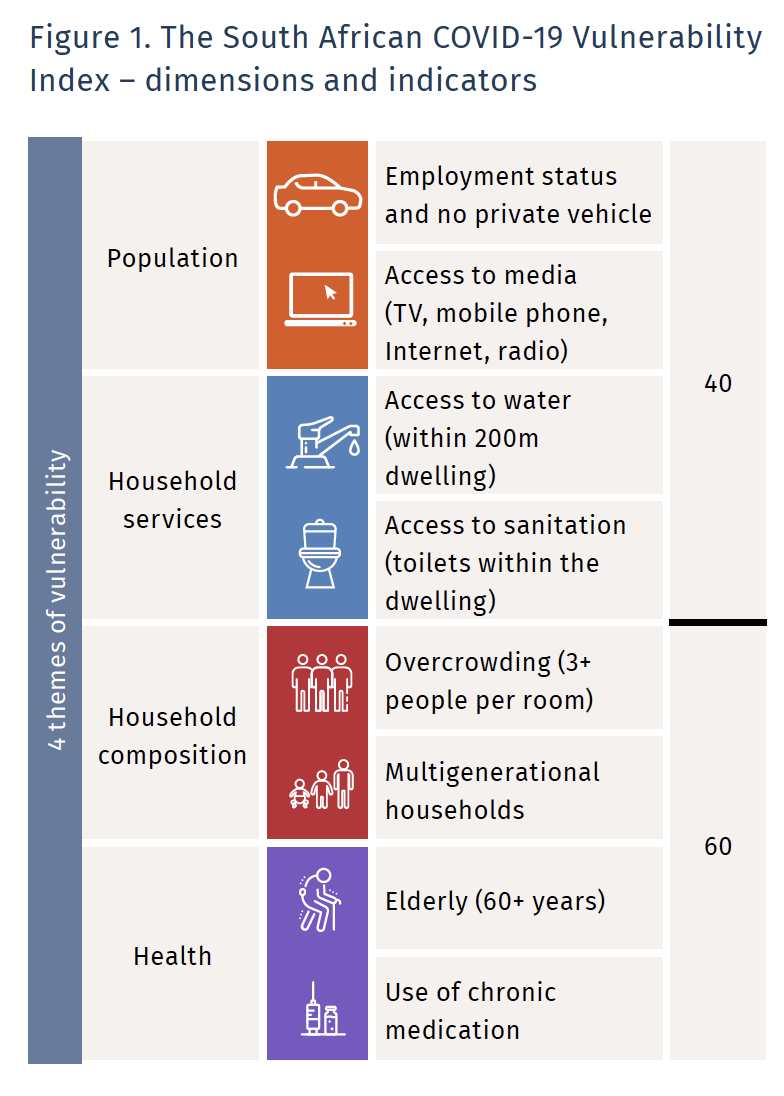
The SACVI was compiled using an adaptation of the Alkire-Foster method. The index has four dimensions and eight indicators related to labour force activity, access to media, household services, multigenerational status, age and chronic illness. The indicators have equal weight in the index, therefore each indicator weights 1/8.
According to the SACVI, 40% of the population in South Africa is vulnerable to COVID-19. Those who are vulnerable are deprived in at least 27.1% of the weighted indicators. The major contributors to vulnerability in South Africa are sanitation and multigenerational households.
The strength of the SACVI lies in its decomposability to low levels of geography, resulting from the use of the Census 2011 data.
The SACVI is published at the lowest possible geographic level to best statistically identify vulnerable populations that are more likely to be affected by the pandemic in terms of who will suffer most if a COVID-19 infection occurred in that specific area.
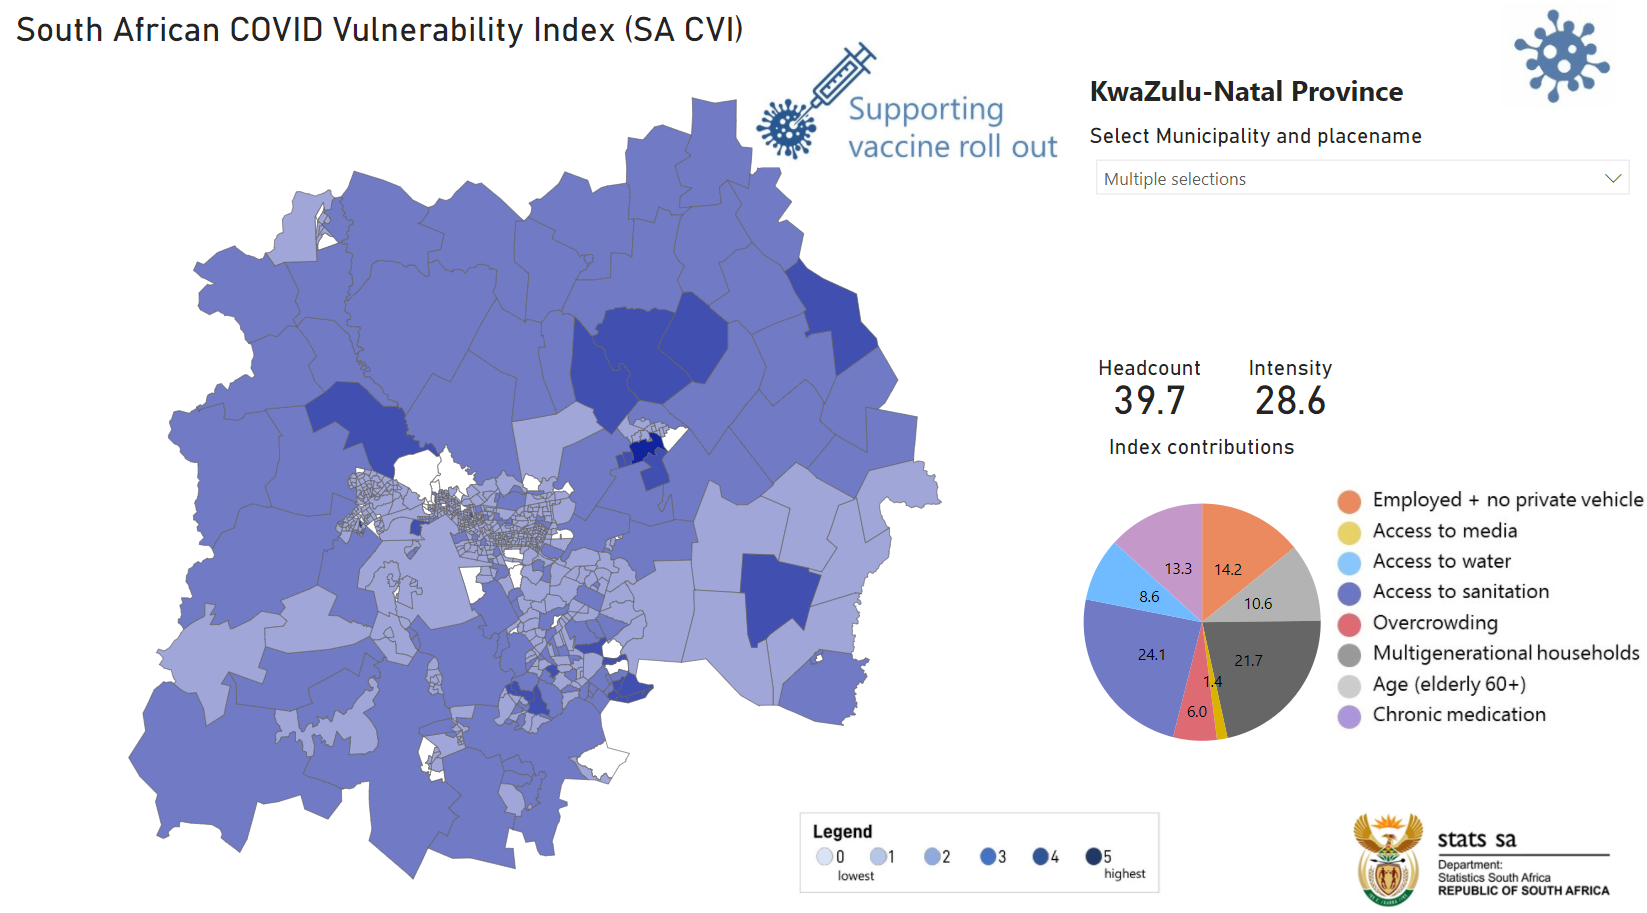
Nine provincial dashboards were created for ease of use for planners, decision-makers and other general users. These dashboards allowed users to select a place within a local municipality in a province to view important statistics, such as vulnerability headcount and the major contributors to the vulnerability situation in that particular area. In addition, the index allowed ranking of areas based on their vulnerability score to inform prioritisation of intervention. The example of a dashboard for an area in the province of KwaZulu-Natal is presented below. The dashboards consist of a map and a chart interface.
According to the SACVI, 40% of the population in South Africa is vulnerable to COVID-19.
The SACVI can serve various purposes. It can serve as a tool to assist with targeted response planning as it highlights areas that are vulnerable to COVID-19. It can also be used for evidence-based pandemic management planning to provide the best and most feasible location-focused response. It can also be used in designing communication campaigns and targeting possible highly vulnerable areas.
The index can also be used to inform the vaccination roll-out to ensure equitable access to vaccines including identifying priority groups for vaccination.
South Africa commenced with the Phase 1 vaccine roll-out in February 2021. Frontline health workers were prioritised. The elderly (especially those living with the younger generation) and the population living with co-morbidities were identified as those with a high risk of fatality should they contract the virus. To support the process of vaccine rollout in the country, Stats South Africa updated the SACVI by allocating higher weights to indicators that are directly linked to a high risk of fatality should the virus be contracted. This includes people in congregate settings, people over 60 years of age and people over 18 years of age who have co-morbidities.
Therefore, indicators on overcrowding, multigenerational households, age (adults 60+) and chronic medication (indicating co-morbidities) were allocated higher weights. Together these indicators contributed 60% to the total index while the remaining four indicators:employment, media, water and sanitation together contributed 40% to the total index as illustrated in Figure 1.
SACVI adapted to support vaccine rollout process Crucial information, such as the location of people to be prioritised for vaccination per vaccination phase, can also be derived from this index. The vaccination phases in South Africa are determined using age; with the exception of Phase 1, which focuses on frontline health workers. The SACVI can be decomposed by age, thus enabling ranking of areas with high vulnerability scores within a specific age group to inform vaccination rollout plans in South Africa.
It is important to note that the index used already existing data, therefore it costs nothing to produce as it was compiled and published by Stats SA staff working remotely.
The SACVI has been published on the Stats SA website, and presented widely to various stakeholders.
(1) Thanks to Nozipho Shabalala for her contributions to this article.
This article was published in Dimensions 13

