


Search
Using the MPI to maximise equitable programming in a flagship sexual and reproductive health programme
By Meg McLaren, MSI Reproductive Choices.


MSI Reproductive Choices is made up of 9,000 team members working across 37 countries to deliver compassionate, high-quality sexual and reproductive healthcare for all. We currently serve more than 75,000 people daily with services and products, and an estimated 34 million women and girls worldwide use a method of contraception provided by us.
There are still over 35 million unsafe abortions happening globally every year, and over 257 million women and girls want but have little or no access to contraception. Our ambition is bold: by 2030, no abortion will be unsafe and everyone who wants contraception will be able to access it.
To achieve this goal, it is critical that no one is left behind: a pillar underpinning our strategy, MSI 2030. Evidence shows that people living in poverty have disproportionate barriers to accessing sexual and reproductive health services, so to level this inequality we will ensure that by 2030, the proportion of MSI clients served meets or exceeds the national poverty level.
Expanding access to marginalised groups has been a core tenet of the organisation for decades. Our mobile outreach approach, in operation for over three decades, was designed to serve the hardest to reach. MSI has collected data on the socio-economic status of clients for 11 years through over 160,000 exit interviews and through millions of client visits in countries utilising MSI’s pioneering approach to the routine collection of poverty data. This data has been used to drive the design and implementation of programmes that are amongst the most equitable globally.
A recent catalyst for additional learning on equity has been MSI’s role as the lead partner on Lot 1 of the UK Foreign, Commonwealth and Development Office’s (FCDO) flagship Women’s Integrated Sexual Health (WISH) programme.
The MPI was the metric that made most sense for assessing our impact primarily.
In the lead up to the programme, MSI explored the nuances of a variety of benchmarks for success in reaching those in poverty, a learning process that has continued across the course of WISH. MSI trialled a range of poverty metrics simultaneously over the course of 2018–2020, reaching the conclusion that the MPI was the metric that made most sense for assessing our impact primarily because:
1. It is standardised, holistic and conceptually straightforward to communicate across a vast organisation comprising many different countries, cultures, and experiences.
2. It enables sub-group analysis, the ability to understand how our clients are poor, and means we can benchmark against a comparable population.
We measure the MPI indicators in our annual client exit interview (CEI), a global representative survey of our clients. We calculate the incidence of poverty, H, among our clients and benchmark this against the national incidence of multidimensional poverty H for that year’s global MPI.
Challenges of collecting MPI data in a programme
Administering the MPI in a healthcare exit interview setting rather than a household survey setting brings different challenges. Chiefly, we lack the same resources as larger surveys to collect anthropometric data to compute the nutrition indicator (and client feedback indicated this was uncomfortable and unacceptable in certain contexts). On the advice of OPHI, we mitigated this challenge by not measuring nutrition status, but instead doubling the weight of the other health indicator (child mortality) to account for this.
Creating a national benchmark to compare like with like
Adapting OPHI’s publicly available analysis files, we recalculate national prevalence by omitting nutrition and double weighting child mortality to provide a comparable benchmark (child mortality being much less prevalent than malnutrition).
To further improve the comparability of the benchmark, we also limit the national estimate to women of reproductive age (15–49) to represent the overwhelming majority of our clients.
Using MPI data in the DHS for mapping poverty
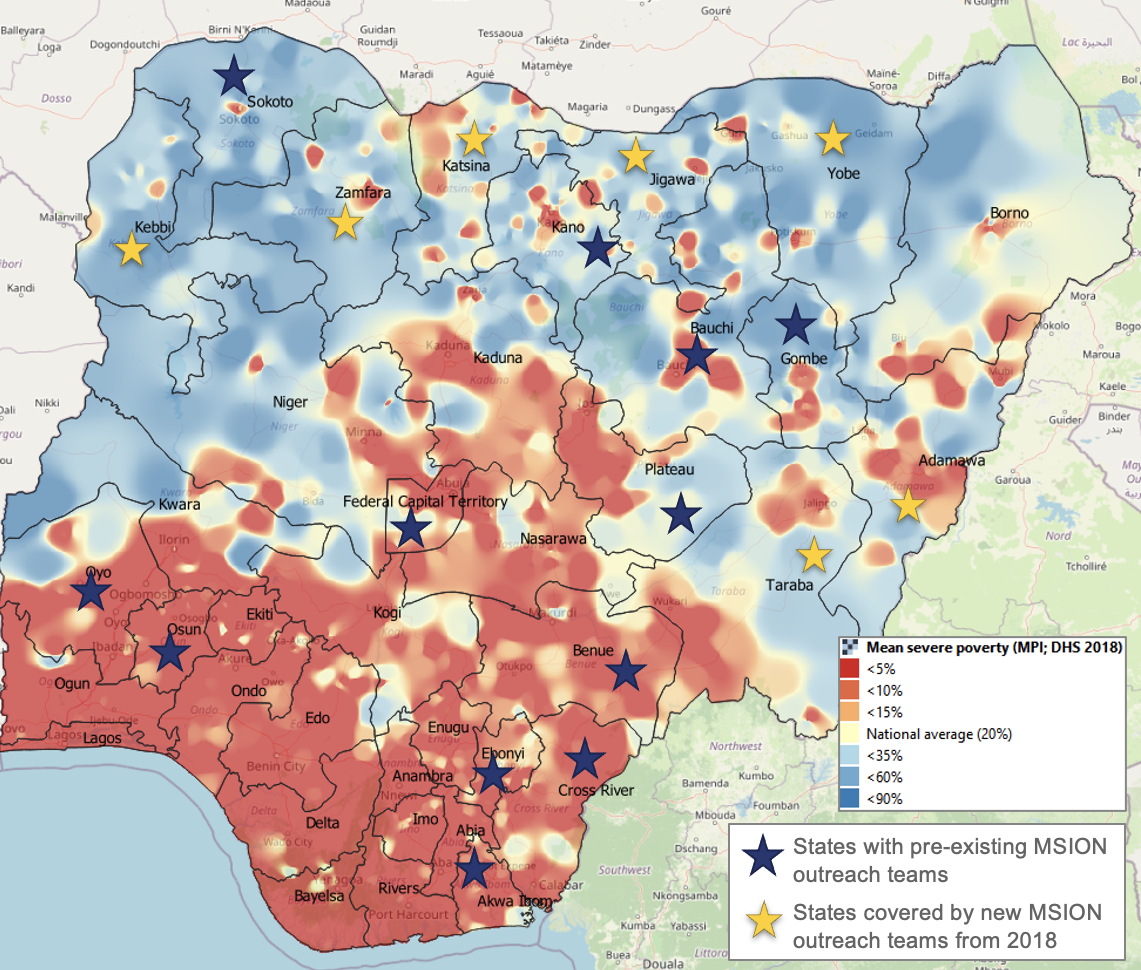
Demographic Household Survey (DHS) datasets are published with geospatial covariates, including GPS coordinates of clusters. Where the global MPI is based on a DHS dataset, we have geospatially visualised the distribution of multidimensional poverty in country in maps using QGIS (based on the mean poverty prevalence per cluster in the DHS datasets).
This supports us to identify communities with the most limited access to sexual and reproductive health services, and we tailor our outreach coverage planning accordingly to make sure no one is left behind. MSI has publicly available guidance on this process, which is forthcoming.
In Nigeria, we used one of these maps as a source of information when deciding where to expand mobile outreach services as part of the WISH programme in 2018. The percentage of outreach clients in Nigeria living in multidimensional poverty effectively doubled following expansion to these states.
The potential for collecting MPI data routinely
Given the cost and scale of the CEI, we only have one annual measure of how well we are doing at reaching people living in poverty. So, we have been exploring ways to collect data on the MPI indicators more frequently, while making sure such data collection is not too burdensome on clients during their visit.
In 2021, two of our outreach teams in Nigeria piloted asking MPI questions in random combinations of two to every client during their registration. From this data, we were able to build a proxy headcount ratio at a group level for clients served by the outreach team. We checked reliability by administering the full MPI question set to every 50th client.
The pilot found that we were able to collect reliable data on the MPI indicators in this way with minimal disruption to clients. We plan to roll this out to all priority countries in our next data systems upgrade at the end of 2022.
We will continue to innovate using the poverty data available to maximise our reach and look forward to sharing further insights and learning from this work.
This article was published in Dimensions 14
Related Posts

