


Search
Building Scenarios for Setting MPI Goals: From Multidimensional Measurement to Multisector Public Policy
By Roberto Angulo and Diego Zavaleta


In 2011 Colombia announced the launch of its Multidimensional Poverty Index (C-MPI). This launch went hand in hand with important institutional innovations and with the generation of public policies informed by that index. A crucial innovation was the creation of a traffic light dashboard to support the work of a Poverty Roundtable, headed by the President of the Republic.
This dashboard contained goals for reducing multidimensional poverty, as well as goals for each one of the components of the C-MPI over four years (the presidential term in Colombia) – all of them set within the National Development Plan (NDP). For example, the number of people living in multidimensional poverty (headcount) was expected to fall from 30.4% to 22.5% between 2010 and 2014. Similarly, the number of people with low educational achievement (one of the indicators of the C-MPI) was expected to fall from 55.4% to 52.8% in the same period, and so on for each of the other 14 indicators of the C-MPI.
In order to define these goals, the National Planning Department (NPD) carried out an innovative policy scenario simulation exercise to estimate an achievement goal for each C-MPI indicator, as well as the global multidimensional poverty goal.
***
Designing the C-MPI coincided with the election period and the change of government in Colombia in the year 2010. The incoming president, Juan Manuel Santos, instructed his collaborators to carry out two tasks: 1) ensuring his government’s NDP had an important and explicit emphasis on reducing poverty and inequality, and 2) designing good governance management tools that would help him monitor results in order to concretely verify outcomes. To this end, the NPD – the ministry in Colombia in charge of estimating poverty levels and designing the national MPI – was first asked to propose the indicators that would track poverty reduction.
Second, the President’s advisory team were asked to design a Poverty Roundtable for the monitoring of the poverty reduction strategy, which would be headed by the President and in which all ministers and heads of administrative departments associated with poverty reduction tasks would participate (an Employment and a Defence and Security roundtable were also established at the same time).
The DNP team decided to carry out what they called simulations and the creation of public policy scenarios for the C-MPI. Specifically, what was done was an exercise in designing counterfactual scenarios using microdata from the Quality of Life Survey based on the simulation of different investments in social sectors, targeting rules, and access to public social services and goods.
In other words, counterfactual multidimensional poverty scenarios were estimated with the microdata transformed for each of the four years of government. Having worked on the survey microdata, the exercise allowed scenarios to be created for the C-MPI by global goal, dimensions, and by each of the specific indicators.
To do so, several steps were followed. The first involved reviewing the NDP’s public expenditure priorities (operational and investment). This fiscal framework made it possible to set an approximate amount of expenditure in social investment for the incoming government. Once the annual social expenditure and investment amounts had been determined, the NPD met with each state institution and ministry in the social sector to devise an investment plan for the four-year period and to specify all the projects and investments that the institution or ministry were planning for the term (including those related to poverty reduction and those that were not).
These plans were later embodied in the NDP as sectorial targets. It is important to make it clear that all these plans had annualised budget allocations and were capable of being territorialized since several of them corresponded to earmarked expenditures defined by a region specified by law. This step, which is a routine process of the national government in the formulation of the NDP every four years, served as a framework for the exercise of building C-MPI scenarios.
The team in charge of the C-MPI used these discussions to identify all the specific investment or expenditure commitments within each ministry or institution that would directly impact the C-MPI indicators (for example, the construction of social housing for the population in extreme poverty).
With this information, a simulation of these investments was carried out on the Quality of Life Survey. For this, the different investment or expenditure commitments were taken as completed and the outcomes introduced into the Quality of Life Survey (for example, the construction of 70,000 social housing units for the population in extreme poverty were counted as replacing an equal number of houses considered as deprived).
To make the exercise more realistic, the household and geographical targeting rules of each programme were applied to identify population subgroups (where and for what type of family the Ministry of Housing would build a house with those characteristics given the official targeting rules it follows). Within these subgroups, households were selected randomly whenever the allocations were lower than those needed for the entire potential beneficiary population of the identified subgroups.
Once the outcomes of the investments were introduced in the survey, the effects of these outcomes on each of the MPI indicators (for example, if the investment impacted the adequate flooring and adequate external walls indicators) were identified. Following this, counterfactual scenarios were built with households that would no longer suffer deprivations in these indicators should the investment be made.
Finally, the MPI for those scenarios was calculated in order to determine how the general result would change year after year and how the number of people with deprivations in each one of these indicators would be reduced if the sectorial goals of the NPD were fulfilled. The exercise also made the same macroeconomic assumptions of the NDP, which are routinely set every four years.
These simulations made it possible to deliver sensible goals to the Office of the President. On the one hand, specific goals for the reduction in the multidimensional poverty rate (from 34.7% to 22.5% in four years) were added to the NDP. This was done by introducing MPI-related exercises to the traditional sectorial exercise for the design of development plans in Colombia. On the other hand, these simulations made it possible to populate the dashboard with specific goals, track the advances towards achieving them, and inform the policies and programs designed to achieve them in case the established milestones were not being met.
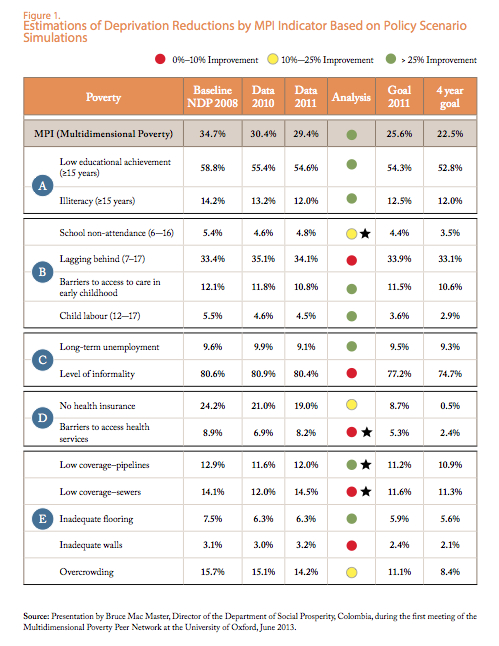
As can be seen in Figure 1, the dashboard was fed these simulations for each of the indicators of the C-MPI. Thus, for example, the baseline for the low educational achievement indicator for the year 2008 (58.8%), the annual goals, and the goal for the four-year period (52.8%) were available. After a year, the actual data was contrasted with the goal and the progress status was defined (red if improvement was 0%–10%, yellow if 10%–25%, and green if over 25%).
We can therefore see that 54.3% was estimated for that indicator for 2011 and that the actual figure was 54.6% (thus a green dot was assigned to the goal as substantial progress towards the goal was achieved). This enabled the President and the ministers to visualise the indicators very easily and, consequently, see the sectors where there were problems, allowing them to devise a solution, if necessary, in order not to miss the general goals.
Quarterly estimations of progress towards the goals were also done for some indicators based on administrative records. For example, the NPD team examined the administrative records of the health ministry each quarter to analyse the number of new enrolments in the health insurance system and the backgrounds of the new beneficiaries. This allowed them to calculate a proxy of improvements in specific indicators of the MPI within each year.
In general, the estimations of these exercises reasonably matched the observed outcomes. In some cases, delays were observed, but these were explained by management problems (which goes to show the value of these estimations as a tool for guiding public policy). However, other sectors accomplished their goals faster than expected, compensating for some of the delays. Therefore, the forecast was not met in detail, sector by sector, but the final aggregate ended up being very close.
This point is crucial for understanding the potential of the MPI as a public policy monitoring tool: While it is true that there is a corresponding expected path (a set of intermediate yearly milestones) for each indicator in order to reach the estimated overall goal for multidimensional poverty reduction, there exist multiple ways of achieving that goal. That is to say, the overall goal can be achieved by multiple combinations of improvements in the indicators. A delay in meeting one of the indicator goals due to unforeseen circumstances or management problems can be compensated for by improvements in other indicators above what was expected. In this sense, the dashboard can flag delays in progress towards specific indicator goals, but at the same time it shows alternatives for continuing improvements towards the overall goal at the desired speed.
It is important to stress that this exercise translated sectorial goals (financed and included in an investment plan) into simulations of how the C-MPI would change if they were met. However, this exercise could also be reversed: multidimensional poverty reduction goals can be set (as well as reductions in deprivations by indicator) and the cost of achieving this estimated using the same exercise. In this way, for example, a country could have an estimate of the cost of achieving a specific number of the SDGs or national priorities given reasonable assumptions with respect to the macroeconomic environment and the demographic and socioeconomic conditions.
The exercise of setting goals based on scenarios proved to be a very important organizational tool for social policy and enabled the sectors to understand the importance of coordinating efforts and the inter-connections of their work in terms of poverty reduction. It also gave the President an executive tool to monitor the poverty reduction efforts of the government. The C-MPI contributed to turning a multidimensional concept of poverty into multisector public policy.
Original in Spanish. Translated by Alicia Holliday. Read 5th Dimensions Issue here.

