Search
The Insights From a Comparable Child Poverty Measurement: The Case of South Asia

The global multidimensional poverty index (MPI) has been very useful in shining a light on child poverty. When, in July 2017, the global MPI was age-disaggregated to profile children’s poverty, the Executive Director of UNICEF at that time, Tony Lake, stressed in his High Level Political Forum address the headline that half of the world’s poor people who live in acute multidimensional poverty, according to the global MPI, are children. The global MPI is an index of acute multidimensional poverty that covers three-quarters of the world’s population –mainly those living in developing regions– and over 100 developing countries. It is produced by OPHI at the University of Oxford with UNDP’s Human Development Report Office.
A Step Further
In 2018, in collaboration with OPHI, UNICEF’s regional office in South Asia wanted to take this headline on child poverty a step further and worked on a study titled ‘The State of Child Poverty in South Asia: A Contextual and Gendered View’. We already knew that half of the world´s MPI poor people were children and that children had higher levels of deprivations than adults in each of the ten indicators of the global MPI. But for policy action we wanted to look further within the household and see the gender of the children, their age and their family circumstances.
Through the empirical insights provided by this study, we aim to catalyse debate and strengthen actions to redress the immense toll of child poverty in South Asia. We focus on seven South Asian countries: Afghanistan, Bangladesh, Bhutan, India, Maldives, Nepal and Pakistan. We use Demographic and Health Surveys (DHS) for six countries and the Multiple Indicators Cluster Survey (MICS) for Bhutan. The data came from 2010–2017/18 with Bhutan having the oldest data (2010) and Pakistan the most recent (2017/18). Since this builds on surveys from seven countries, the numbers are large enough to even be disaggregated to specific age intervals. This provides very important insights and the ability to link and study policy actions and even budgetary allocations with regards to current levels of investments.
How do we zoom into children’s lives? The global MPI is based on individual level data for three of the 10 indicators. These are: nutrition, years of schooling and school attendance. In each indicator, child information is included. In the case of nutrition, we draw on children aged 0–5 and consider a household deprived if any child is stunted and/or underweight in that household. In years of schooling, we count a household deprived if no child aged 10–17 and no adults have completed at least six years of school. For school attendance, a child is identified as deprived if he or she is not attending school up to the age at which he or she should complete class eight and has not yet completed it. We look at children’s deprivations in these indicators up close.
The motivation is to influence the policy process and its outcome in South Asia by looking at individual child deprivations and linking it to life cycle-based analysis, as deprivations affect children across separate age cohorts. The lack of this sort of solid evidence creates incentives for politicians to sometimes engage in a policy process and outcome that is driven by expediency or short-term gains for their own constituencies. Generating and building easy to consume evidence helps them to make better and informed decisions, especially if the social outcomes are aligned with political advantage.
One in eight children in South Asia, at this time of rapid intergenerational change, is a pioneer child within their household.
Within the context of the household, we see that poor children have distinctive patterns of deprivations and that this varies by gender and region and in terms of intra-household inequality. Such information is very useful for effective policy and resource allocation.
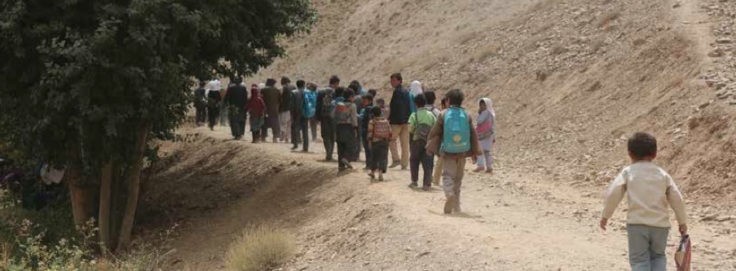
We give just one example in the study –the fascinating case of pioneer children in South Asia. We define pioneer children as children aged 10–17 who have completed six years of schooling and live in households where no adult has done this; they are thus the first generation with this accomplishment. Rather unexpectedly, we ran across an amazing fact: one in eight children in South Asia, at this time of rapid intergenerational change, is a pioneer child within their household. There are actually 37.5 million such children in the region. And rather surprisingly, the percentage is higher among girls than boys.
We celebrate the achievements of pioneer children but are disconcerted by some other surprises. Alas, 10.5 million pioneer children are multidimensionally poor by the global MPI. Around 63% of pioneer children in India still used open defecation in 2015 and 24% of pioneer girl children in Bangladesh in 2014 had been married early. Also, we see stark intra-household inequality: one-third of pioneer children share their household with another child aged 10-17 who sadly has not completed six years of schooling and is not attending school. A multidimensional lens shows the complexity of these interconnections and how they vary across gender, age, and country. Such precision and insights sharpen policy.
So, this study has methodological innovations: it is the first study to shine a light inside households using the global MPI and unpack gendered, intra-household and other details using the child-specific indicators. Methodologically, we hope that, in the future, reports of multidimensional poverty indices that are constructed at the household level on the basis of individual data, will undertake this kind of gendered and intra-household analysis.
This article was published in Dimensions 7.


